


Prediction Markets and the House

This is the latest in a series of posts on prediction markets and the November elections in the United States.
I have previously argued that such markets can be extremely valuable as forecasting mechanisms in historically unprecedented conditions, but also have certain shortcomings relative to statistical models. A proper comparison of predictive accuracy thus requires us to look at data from a large number of events.1
This post is concerned with the relative performance of markets and models in predicting the outcomes of close races for the House of Representatives. There were twenty-two districts that were rated as highly competitive by the New York Times prior to the election, of which thirteen had corresponding contracts listed on Polymarket by mid-September. Four of these were in California, two each in Arizona and Iowa, and one each in Alaska, New York, Oregon, Pennsylvania, and Washington.2 Democrats ended up winning five of these races, and Republicans eight.
Two statistical models generated daily forecasts for all house races—FiveThirtyEight and the Economist. The former are available only from October 1 onward, so this will be the period of observation in the analysis here.3
To start with, consider two races in California that broke in different directions: Adam Gray (D) prevailed over John Duarte (R) in CA-13, while David Valadao (R) defeated Rudy Salas (D) in CA-22. The following figure shows the probability of a Republican victory in these two districts, as generated by the two models and the market:
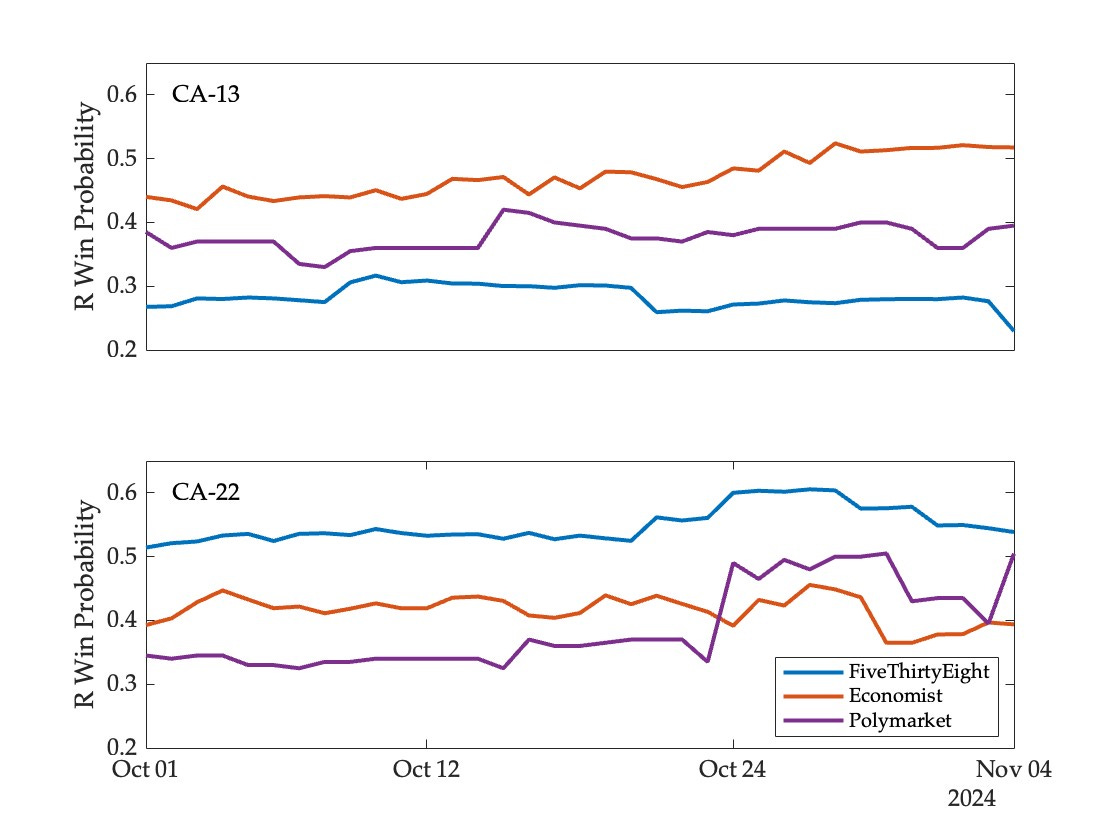
In both races the FiveThirtyEight model performed best throughout the five week period of observation, assigning the lowest likelihood (among the three forecasting mechanisms) to a Republican victory in CA-13, and the highest likelihood in CA-22. The Economist model and Polymarket are harder to rank based on a visual inspection—the market did better in CA-13 while the model did so for the most part CA-22.
Aggregating across all thirteen races, we can compute a measure of forecasting accuracy based on the average daily Brier score.4 If pnt denotes the probability assigned to event n at date t by a given mechanism, rn represents the eventually realized outcome (equaling one if event n occurs and zero otherwise), and N is the total number of events, we can obtain a time series of average scores for the mechanism using
These scores lie between zero and one, and lower scores are indicative of superior forecasting performance. Aggregating across all thirteen races for which we have model and market data yields the following picture of forecasting accuracy:
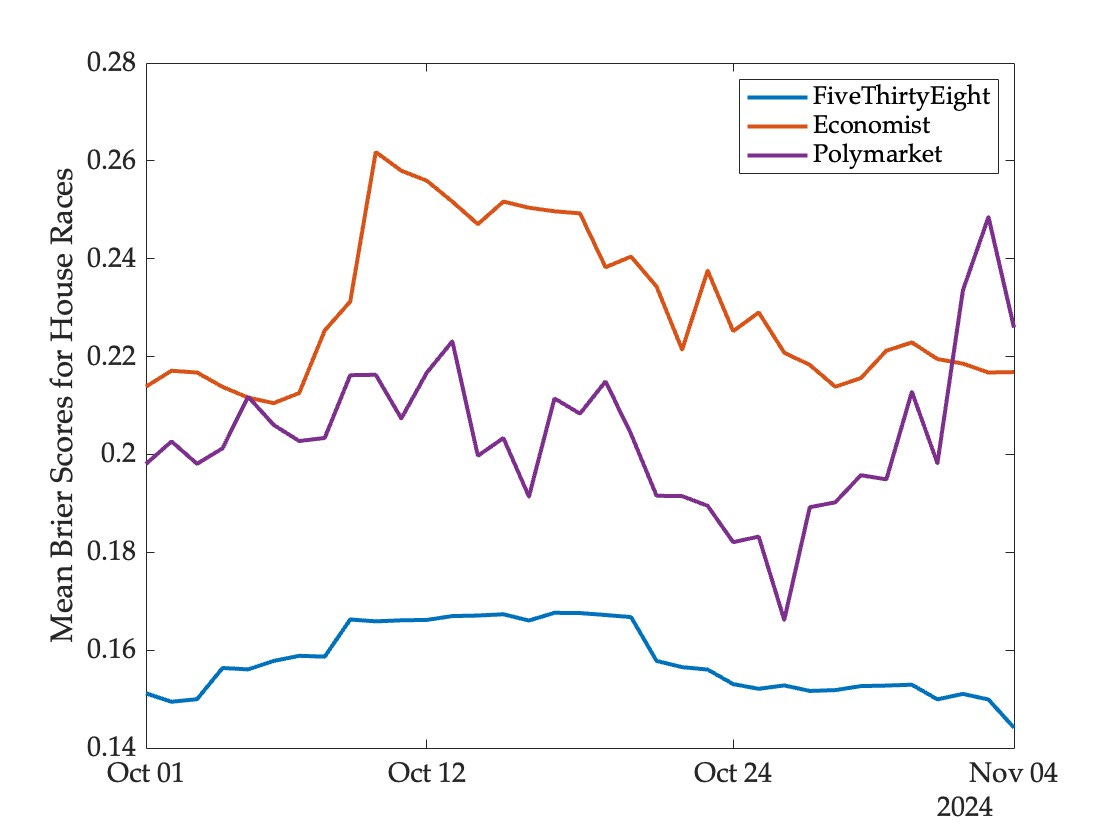
It’s clear that the best performer (regardless of distance from the election) is the FiveThirtyEight model. Polymarket comes in second in most periods, but slips to third place towards the end.
Averaging scores across time as well as events, we obtain the following measures of performance.
This confirms the visual impression from the time series figure—FiveThirtyEight performs best, and Polymarket comes out ahead of the Economist.
Since the model forecasts were public information and thus available to market participants, what explains the under-performance of the market here?
The ability of markets to absorb novel sources of information and a broad range of perspectives is both a strength and a weakness—the market mechanism can perform much better than models when history is a poor guide to the future, but it can also exhibit overreaction and excess volatility.
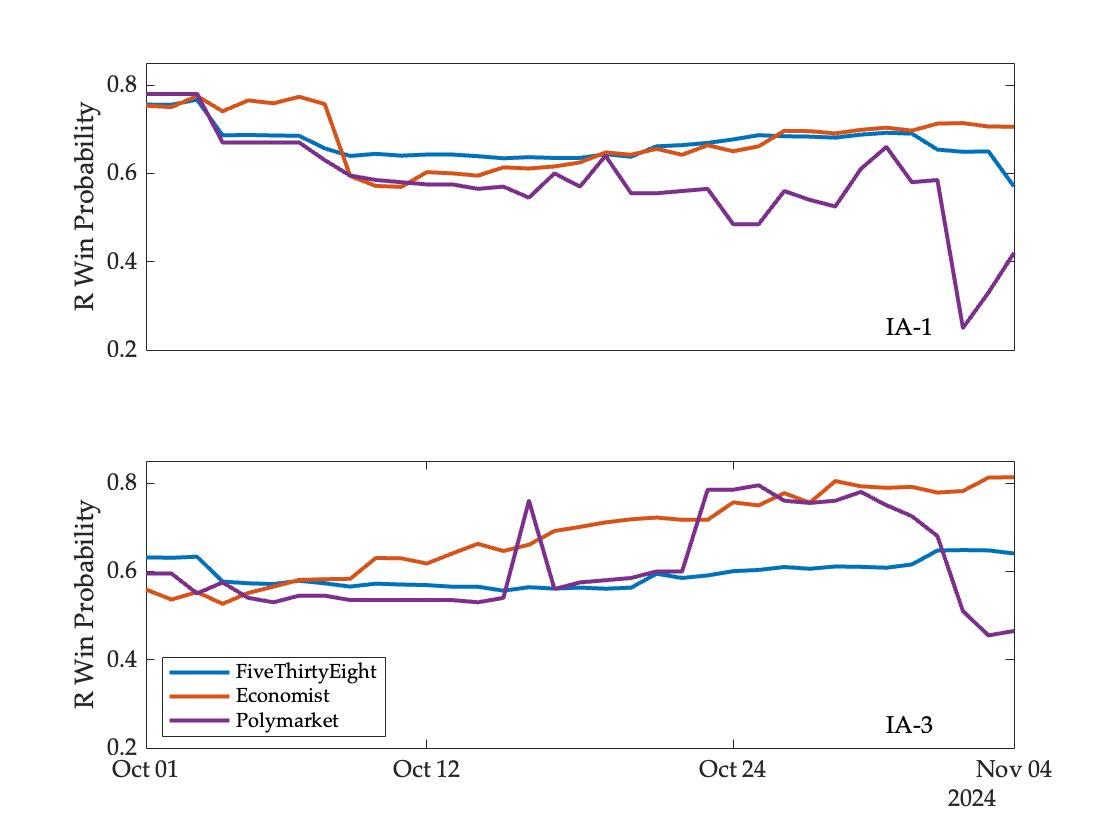
To illustrate, consider the market reaction to a very surprising poll released on November 2 that showed Harris leading Trump in Iowa. On Polymarket, the likelihood of a Republican victory in the two most competitive Iowa districts fell sharply—from 58 to 25 percent in IA-01 and from 68 to 51 percent in IA-03. Changes in model forecasts were much more modest:5
Since the Republican candidates ended up winning both races in the end, this boosted the measured performance of models relative to markets as the election approached.
The bottom line is this—prediction markets are a useful part of the forecasting ecosystem, especially in a rapidly changing world in which few historical regularities can be taken for granted. But they are not a magic bullet, and do not make other approaches redundant. For one thing, statistical models make their presence felt in market prices as traders observe and assess them in relation to other evidence. And many questions remain unanswered about the effects of different market designs and constraints on participation.
It is true that markets performed somewhat better than models in predicting the winner of the American presidency. But evidence from a single event cannot be considered decisive. The analysis of competitive house races makes this abundantly clear, and points to a much more nuanced picture of the relative performance of different forecasting mechanisms.
There’s a thirteen minute clip from a conversation with Glenn Loury that summarizes much of my thinking on models and markets as forecasting mechanisms (this elicited the most gratifying comment I’ve ever received on social media.)
Specifically, the districts were AK-01, AZ-01, AZ-06, CA-13, CA-22, CA-27, CA-41, IA-01, IA-03, NY-19, OR-05, PA-10, and WA-03. Kalshi also listed contracts referencing these races (and some additional ones) but not until October 31.
I’m extremely grateful to Dan Rosenheck for the Economist data and Elliott Morris for the data from FiveThirtyEight.
For reasons discussed in an earlier post, there are conditions under which the Brier score may lead to misleading inferences about forecasting accuracy, and an alternative approach based on a profitability test may be preferable. But for the house races both approaches lead to the same general picture.
Note that the Economist model performed better than FiveThirtyEight in these two races, especially in IA-03.
Hybrid forecasting (combining models and markets for example) is a very promising approach. Two ways to do it, one could use market prices as a model input or you could have trading bots representing models active on markets. Of course markets do absorb model forecasts in any case but it would be interesting to see if experimental interventions using models result in more accurate predictions.
One of the principles in building model ensembles is that you should incorporate models that encode diverse assumptions regarding the X --> Y mapping. Using similar logic, consolidating information from statistical models and prediction markets should help us make better predictions on average unless one takes what is, in my estimation, the radical view that election forecasting is a lost cause. Decision Desk used an ensemble of machine learning algorithms to generate probabilistic forecasts, but the ensemble I'm thinking of is taken across all statistical and market predictions. Did someone do a prospective aggregation of this sort that you know of?