


Prediction Markets and the Election

On the eve of the November elections in the United States, the three most closely watched statistical forecasting models had essentially converged to a coin flip. Meanwhile prediction markets had Trump slightly favored, with Kalshi assigning him a 55 percent probability of victory and Polymarket a 59 percent chance.
Based on these odds and the eventual outcome of the election, many observers claimed victory for markets as forecasting mechanisms. I felt at the time that such definitive judgments were premature, and that one really needed to examine a broader range of events—including state level outcomes and competitive congressional races—before reaching firm conclusions.
In order for such an analysis to be conducted, one first needs to decide on the criteria on the basis of which forecasting performance is to be evaluated. In this post I will argue that conventional measures of accuracy have certain shortcomings, and make a case for an alternative approach. I’ll illustrate these arguments using market and model forecasts referencing the state of Wisconsin.1
The figure below shows the probability assigned to a Trump victory in Wisconsin by two models (top panel) and two markets (bottom panel) over the ninety days leading up to the election:
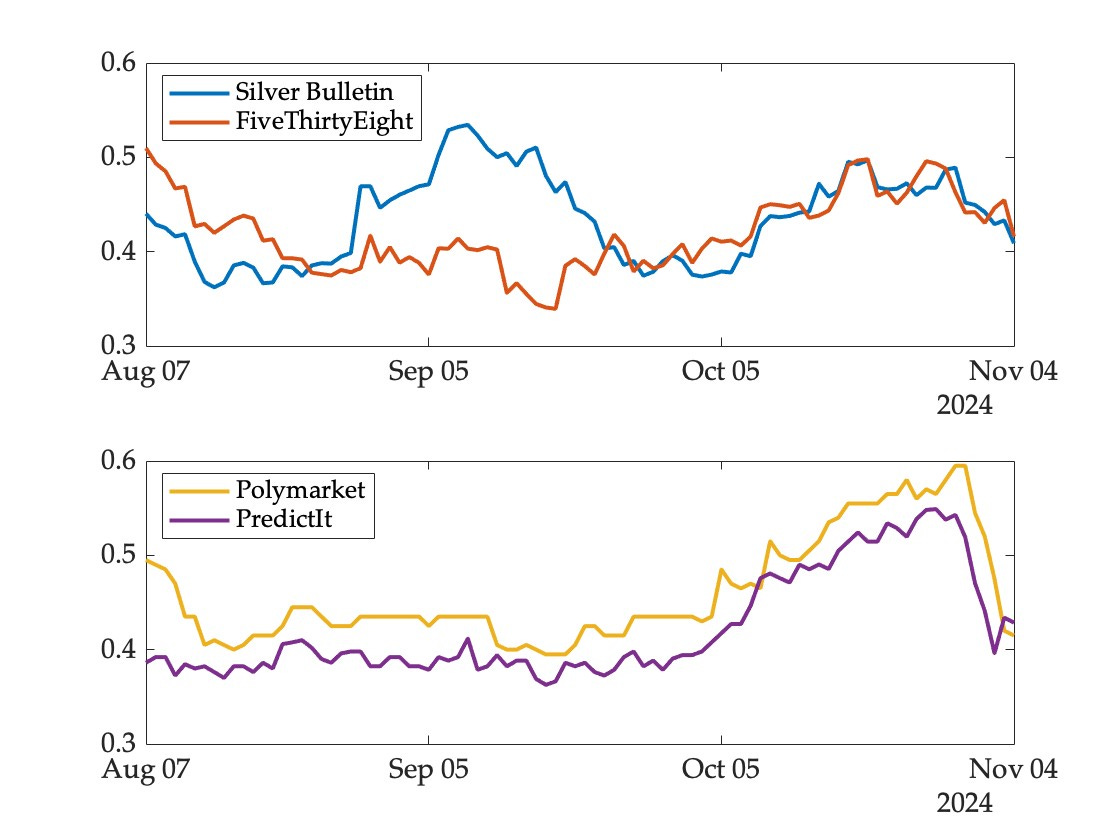
There are two striking patterns here.
First, although the models converged eventually, there was substantial disagreement between them for several weeks in August and September. This was primarily due to a dubious convention bounce adjustment that shifted the odds significantly towards Trump in the Silver Bulletin model.2 Since he ended up winning the state, the model would be rewarded for this excursion by conventional measures of predictive accuracy. But it ought not to be—many observers argued at the time that the adjustment was a flaw in the model, and correctly anticipated that the forecast would eventually fall back into line with those of other models. This happened in late September as the conventions receded into the past.
Second, unlike the models, the two prediction markets tracked each other quite closely. This is not a coincidence—when markets referencing the same event disagree, a profit opportunity is created and the resulting trades bring markets into closer alignment with each other. For example, if the price of the Trump contract were 60 in one market and 50 in another, one could buy the cheaper contract and and bet against him (at 40) in the other market, effectively buying a dollar for 90 cents. Fees and other transactions costs prevent complete alignment of prices across markets, but the divergence cannot be too extreme.
Unlike models, therefore, one cannot assess the predictive accuracy of a given market in isolation—movements on one market contaminate prices on others.
With that preamble out of the way, consider what conventional measures of predictive accuracy would have said about these four forecasting mechanisms. One widely used gauge is the average daily Brier score, which for binary events is just a mean squared error. If pt denotes the probability assigned to an event at date t, and r represents the eventually realized outcome (equaling one if the event occurs and zero otherwise), the average daily Brier score for a mechanism that generates forecasts over T days is simply:
This measure lies between zero and one, with lower scores corresponding to more accurate forecasts. If one simply flipped a coin to guess the outcome (which some have argued might be just as effective based on our current state of knowledge) the score would be 0.25 regardless of the eventual outcome.
The average daily Brier scores obtained by the four forecasting mechanisms for the Wisconsin race are as follows:
In Wisconsin, all four mechanisms performed worse (based on this measure) than a completely naive coin flip. That said, with an assist from the convention bounce adjustment, the Silver Bulletin model came out ahead of FiveThirtyEight and PredictIt (though still behind Polymarket).
Does this reflect a superior model or a problem with the method of evaluation? In this case the latter, since the model’s excursion into Trump territory was eventually and predictably reversed. This doesn’t just apply to the Wisconsin forecasts—the model exhibited similar patterns (by construction) in every competitive state and in the headline market.
This raises the question of whether there is a different way to evaluate forecasting accuracy that would not reward such predictably reversed movements.
My preferred alternative is a profitability test, based on the idea that a better model should result in larger profits (or smaller losses) if used as a basis for trading on a prediction market. For each model-market pair, one can construct a (hypothetical) trading bot endowed with an initial budget and some degree of risk tolerance. The bot inherits beliefs from the model at each daily update and executes trades at the prevailing prices. Daily adjustments to the portfolio arise in response to changes in model forecasts and market prices. The overall rate of return earned over the entire period can then be used as a measure of forecasting accuracy.
To illustrate, consider a bot representing the Silver Bulletin forecast trading on PredictIt. The probabilities assigned to a Harris victory by the model and the prices of the Harris contract on the market are shown in the figure below, along with the evolution of the trader’s portfolio over time:3
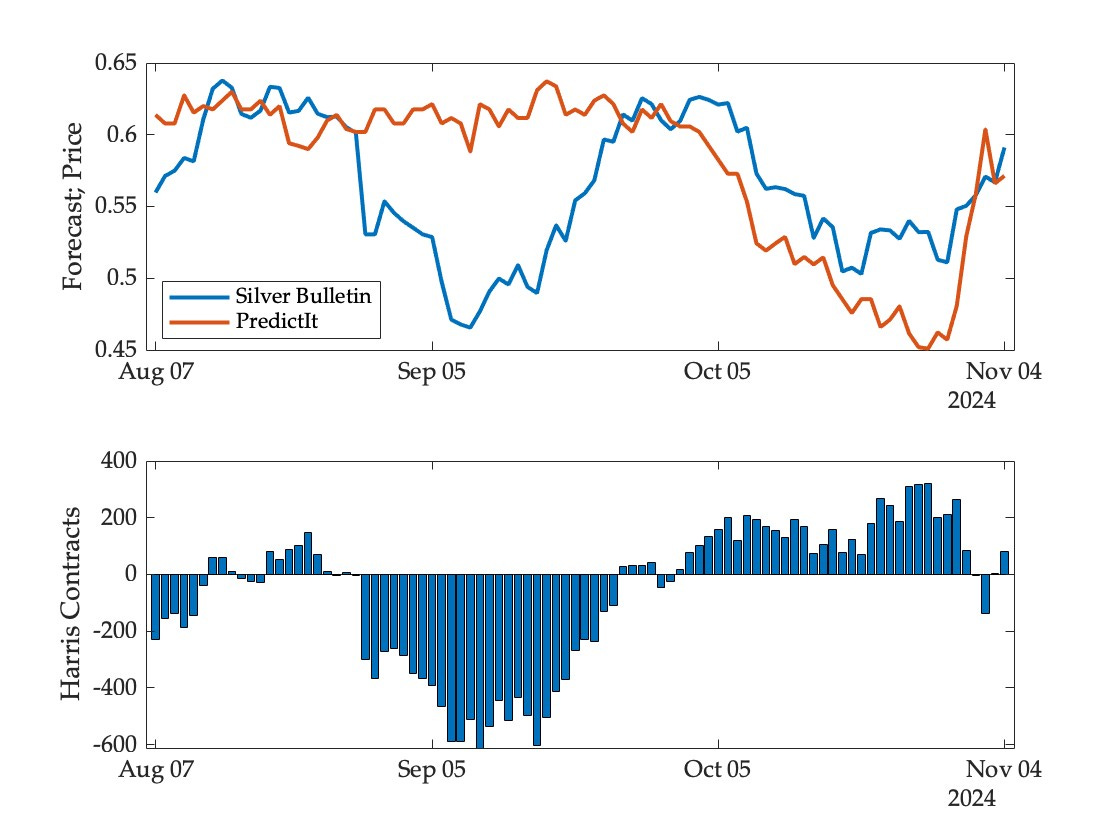
Initially the model bets modestly against Harris (believing the price to be a bit too high) but this is quickly reversed. It then starts to bet heavily against Harris as the convention bounce adjustment creates a significant wedge between model forecast and market price. This position is closed out as the adjustment fades and the model and market reach agreement in late September. As the election approaches the model starts to bet on a Harris victory, now believing market prices to be too low. Profits and losses are made along the way, with a final rate of return determined at event realization.
Based on this approach one can compute rates of return for all model-market pairs. For Wisconsin we obtain the following:
In contrast with the conventional accuracy measure, the FiveThirtyEight model does better than Silver Bulletin against each of the markets, and PredictIt turns out to be harder than Polymarket to beat.
The relatively poor performance of Polymarket here is specific to Wisconsin, and arises because the sharp change in price on the eve of the election allows the bots representing the models to close out their positions at a profit. This did not happen in the headline market, where the reversal was more muted and both models would have suffered significant losses.
The results reported here are for a single state, and ought not to be seen as representative. A comprehensive analysis of other swing states as well as competitive congressional races and the popular vote is currently underway. I’m hoping to have this done in time for submission to this year’s Collective Intelligence conference and to post a draft of the paper online within a month.
Prediction markets have certain undeniable strengths over statistical models—they can incorporate novel sources of information, react quickly to unfolding events, and generate meaningful forecasts even in historically unprecedented situations. But they can also exhibit excess volatility relative to underlying fundamentals and create incentives for price manipulation. As a result, the accuracy of markets relative to models cannot be determined by logical reasoning alone—it is an empirical question that can only be answered with data. The recent emergence of several new markets and contracts is generating the necessary data, but it is far too soon to consider the question settled.
Wisconsin is one of two states (the other being Georgia) for which contracts were listed on both Polymarket and PredictIt. These two exchanges were active for the entire three month period between the official selection of Harris as the democratic nominee and the general election. Kalshi began to operate only in October and thus generated much less data.
The adjustment initially shifted the odds towards Harris (in the shadow of the Republican National Convention) but this effect was less pronounced.
The bot was endowed with $1,000 initially and chose trades to maximize the expected value of the logarithm of terminal wealth; see this paper for a detailed description of the methodology.