An Election Day Update on Forecasting Mechanisms
It’s Election Day in America, which on my calendar is something close to a sacred occasion.
Over the past few months many of my posts here have dealt with the relative accuracy of statistical models and prediction markets, and today these forecasting mechanisms face a major test.
Astonishingly, the three statistical models that I have been tracking converged yesterday to virtually identical forecasts, all at a literal coin flip.1 This is the path they took to get there:
As you can see, the Silver Bulletin forecast took a long detour into Trump territory thanks to a questionable convention bounce adjustment, but has been in close alignment with the other two models over the past month.
I have also been tracking three prediction markets but only two of them have been active over this entire period. These have generally been more favorable to Trump, although PredictIt had moved very close to the model forecasts by yesterday’s close:
The cutoff times for Polymarket daily closing prices is midnight UTC or 7pm in New York, which was before Joe Rogan’s endorsement sent the Trump contract rocketing up on that exchange.
The markets are very active today, of course, responding to news (and rumors) about the scale and demographics of turnout, exit polls, and other bits and pieces of information. But a proper comparison of the accuracy of forecasting approaches has to judge them at roughly the same points in time. For this purpose I’ll use the daily model forecasts and closing market prices up to and including yesterday.
My approach to evaluation relies on a profitability test—each model can be represented on each market by a virtual trader endowed with beliefs inherited from the model, as well as a budget and a degree of risk tolerance. This hypothetical trader will build and adjust a portfolio over time, and the returns earned can serve as a measure of performance.
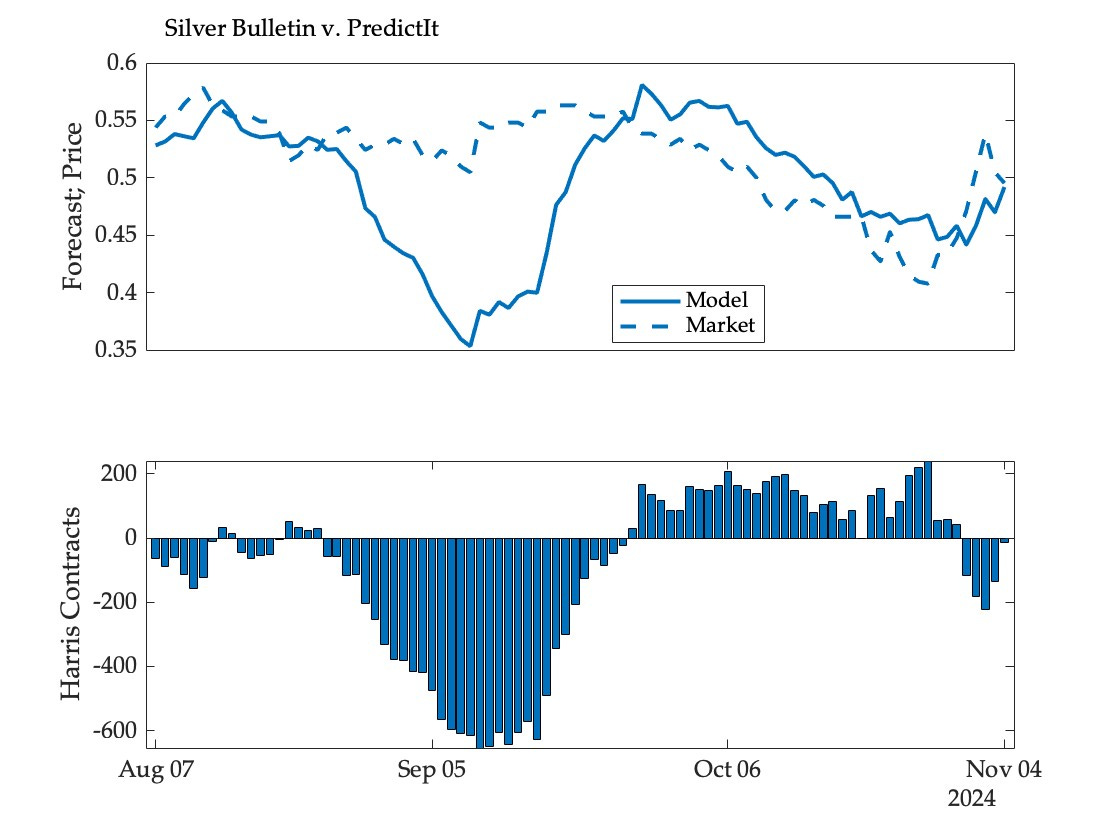
The following figure shows the gap between Silver Bulletin forecasts and PredictIt prices for the Harris contract (top panel) and the evolution of resulting portfolio held by the trader representing the model on this exchange:
The trader was betting heavily against Harris in September (when the model assigned a very high likelihood to a Trump victory), then reversed course in October, and ended up with essentially no position at the end, when the model and the market were in close agreement.
The value of the resulting portfolio (at prevailing market prices) is shown below:
So the trader representing Silver Bulletin had a negative return as of yesterday. But since the number of contracts now held by this trader is very small, this portfolio will make a loss regardless of who wins today.
The returns as of yesterday for all six model-market pairs was as follows:
As I have found in some earlier iterations of this exercise, PredictIt has been hardest to beat, and Silver Bulletin the least profitable.
The outcome of the election will affect the evaluations in the second column substantially, since all portfolios had significant positive bets on Harris at Polymarket prices. If she wins the returns will be much larger, ranging from 13 to 18 percent. And if she loses all models will have returns of roughly negative 10 percent.
The first column will change much less, since there isn’t much difference now between model and market forecasts. In particular, the signs of the returns will not change based on the outcome.
I’ll have more to say about this in due course, once we have looked at all swing states and congressional races.
If you’re reading this and haven’t yet voted, what are you waiting for? Forecasting mechanisms, while fascinating (to some), are much less important than participating in collective action! And voting, even in states like mine that are not remotely competitive at any level, is far more rational than some would have you believe. If you have the opportunity, don’t let it pass.
The Economist posted an update today giving Harris a 56 percent chance of victory, thus separating itself from the pack.


I like this method a lot. In defense of the polling based models, they predicted more polling error than betting markets (see on my Substack for more detail)
Just read this tweet and I'm left wondering how, say, a betting market 68% prediction of a Trump victory translates compared to
50/50 polling aggregate.
https://x.com/JustinWolfers/status/1854165174246097189.
How do you compare them to decide who "wins" - especially when a Trump sweep of the swing states seems pretty much within the margin of error?