A Forecasting Competition
We have just six weeks to go before election day. Most Americans (and a good number of non-Americans) care deeply about the outcome, and are looking to pundits, polls, models, and markets for information about the likelihood that their favored candidate will prevail.
But these sources don’t tell a consistent story. Models disagree with markets and with each other, and this raises the question of which sources, if any, ought to be taken most seriously.
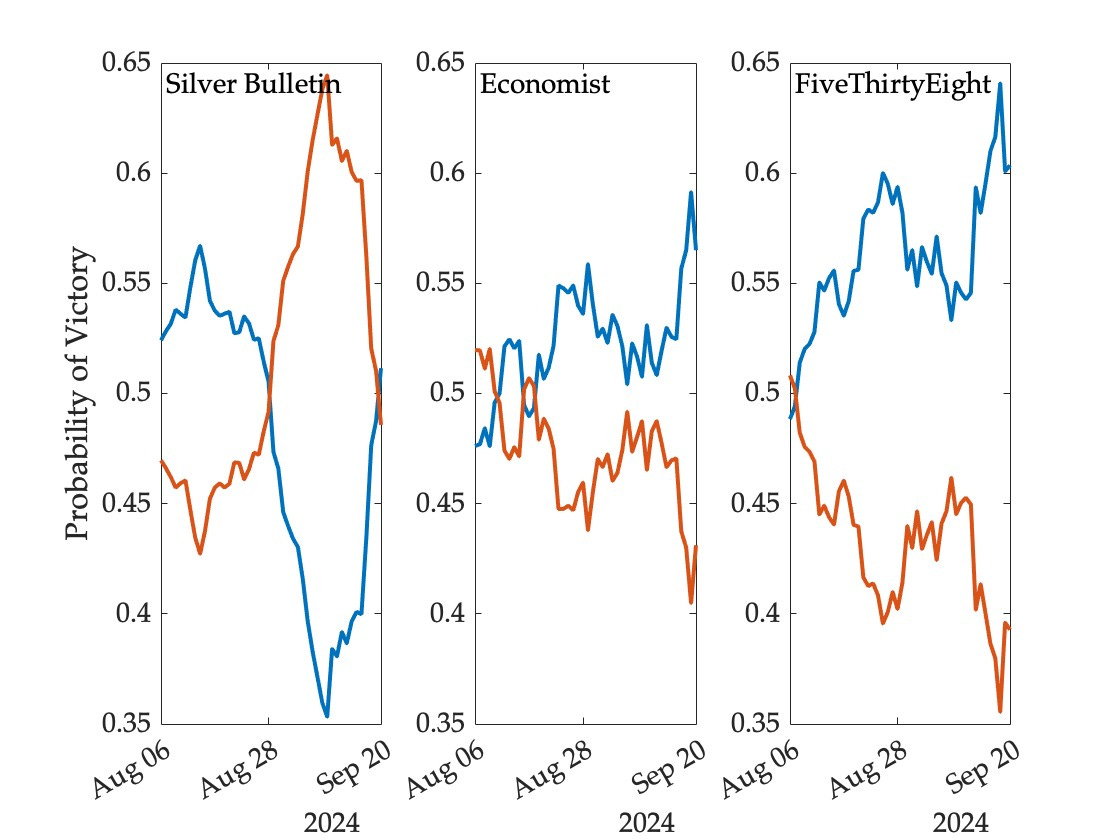
The following figure shows how the likelihood of victory for the two major party candidates has evolved since August 6—the day after Kamala Harris officially secured the nomination of her party—according to three statistical models (Trump in red, Harris in blue):
As is clear from the figure, the Silver Bulletin model has been considerably more favorable to Trump than the other two models over most of this period. About a week ago, for example, Nate Silver gave Harris a 39 percent chance of winning, while the corresponding probabilities were 52 percent at the Economist and 59 percent at FiveThirtyEight.
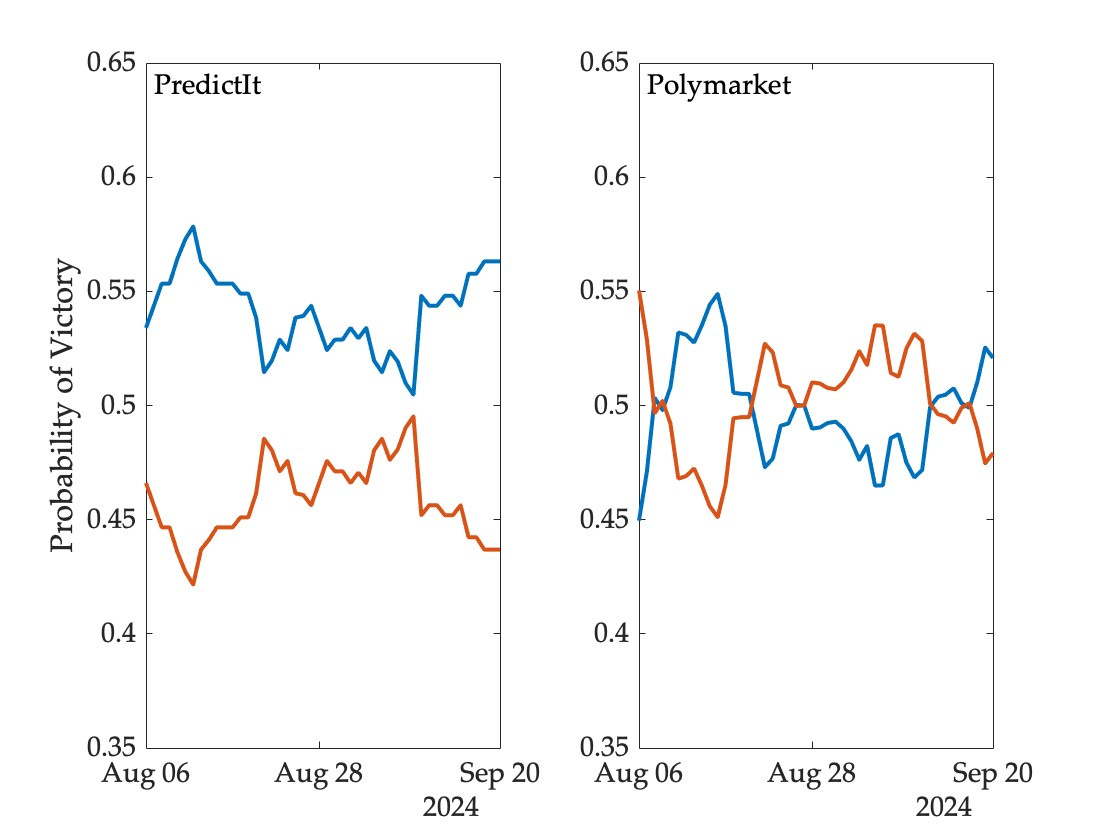
Market-derived probabilities have fluctuated within a narrower band. The following figure shows prices for contracts that pay a dollar if Harris wins the election, and nothing otherwise, based on data from two prediction markets (prices have been adjusted slightly to facilitate interpretation as probabilities, and vertical axes matched to those of the models):
So, as things stand, we have five different answers to the same question—the likelihood that Harris will prevail ranges from 51 to 60 percent across these sources. On some days the range of disagreement has been twice as great.
Is there any way of assessing the relative accuracy of these forecasting mechanisms? The standard approach would involve waiting until the outcome is revealed and then computing a measure of error such as the average daily Brier score. This can and will be done, not just for the winner of the presidency but also the outcomes in each competitive state, the popular vote winner, and various electoral college scenarios.
But there is a method of obtaining a tentative measure of forecasting performance even prior to event realization. The basic idea is this. Imagine a trader who believes a particular model and trades on one of the markets on the basis of this belief. Such a trader will buy and sell contracts when either the model forecast or the market price changes, and will hold a position that will be larger in magnitude when the difference between the forecast and the price is itself larger. This trading activity will result in an evolving portfolio with rebalancing after each model update. One can look at the value of the resulting portfolio on any given day, compute the cumulative profit or loss over time, and use the rate of return as a measure of forecasting accuracy to date.
This can be done for any model-market pair, and even for pairs of models or pairs of markets (by interpreting a forecast as a price or vice versa).
To illustrate, consider the trading activity of someone who believes the Silver Bulletin forecast and trades on PredictIt. The following figure shows the model forecast, market price, and the Harris contracts held by the trader for each day since August 6 (a negative number of contracts indicates that the trader is betting on a Harris loss). The trader was endowed with $1,000 and no contracts at the outset, and assigned preferences over terminal wealth given by log utility (to allow for some degree of risk aversion):
For the first two weeks in this observational window, model forecasts and market prices were roughly the same, resulting in very little trade. Then, shortly after the end of the Democratic National Convention and Kennedy’s exit from the race, the model started to diverge from the market, so the trader representing it began to bet quite heavily on Harris to lose. The sharp reversal over the past few days brought the model closer into alignment with the market, and the trader accordingly reduced exposure to a Harris loss.
But notice that the trader was buying back contracts at a higher price than they were initially sold. That is, if one were to compare the value of the portfolio at the end of the period to the initial budget, the trader representing Silver Bulletin and active on PredictIt would have made a negative return.
Repeating this exercise for each model-market pair, we obtain the following returns:
Among the models, FiveThirtyEight performs best and Silver Bulletin worst against each of the two markets, though the differences are not large. And among markets, PredictIt is harder to beat than Polymarket.
I am not surprised by this latter finding—even though Polymarket has much higher overall volume, the position size limit on PredictIt prevents any given trader from being very large relative to the market and this can improve forecasting accuracy.
Are these models and markets actually generating useful forecasts, more accurate than a coin flip? Some political scientists have recently argued that since elections are rare events, it will take decades if not centuries to accumulate enough evidence to answer this question. Of course, one could add a coin flip trader (who holds the belief at all times that either outcome is equally likely) to the above exercise. Such a trader would have been highly profitable in 2016. But I suspect that aggregating across races and cycles, naive forecasts of this kind would lose quite a bit of money.
There are many shortcomings with the above analysis—I have used daily closing prices on markets instead of synchronization with model updates, considered only one specification for risk tolerance, and looked at just the national winner rather than individual state outcomes and other electoral college scenarios. This is just a glimpse into the work I am doing with students and colleagues, which will be posted and circulated after the election.
I’ll be discussing these issues in depth at a conference next month, and teaching a mini-course on forecasting elections (three hours over two meetings) at around the same time. The course is part of a lifelong learning program open to alumnae and invited family and friends (including parents of enrolled students and relatives of faculty and staff), but if you would like to register and don’t think you qualify, please contact me and I’ll try to make it work.
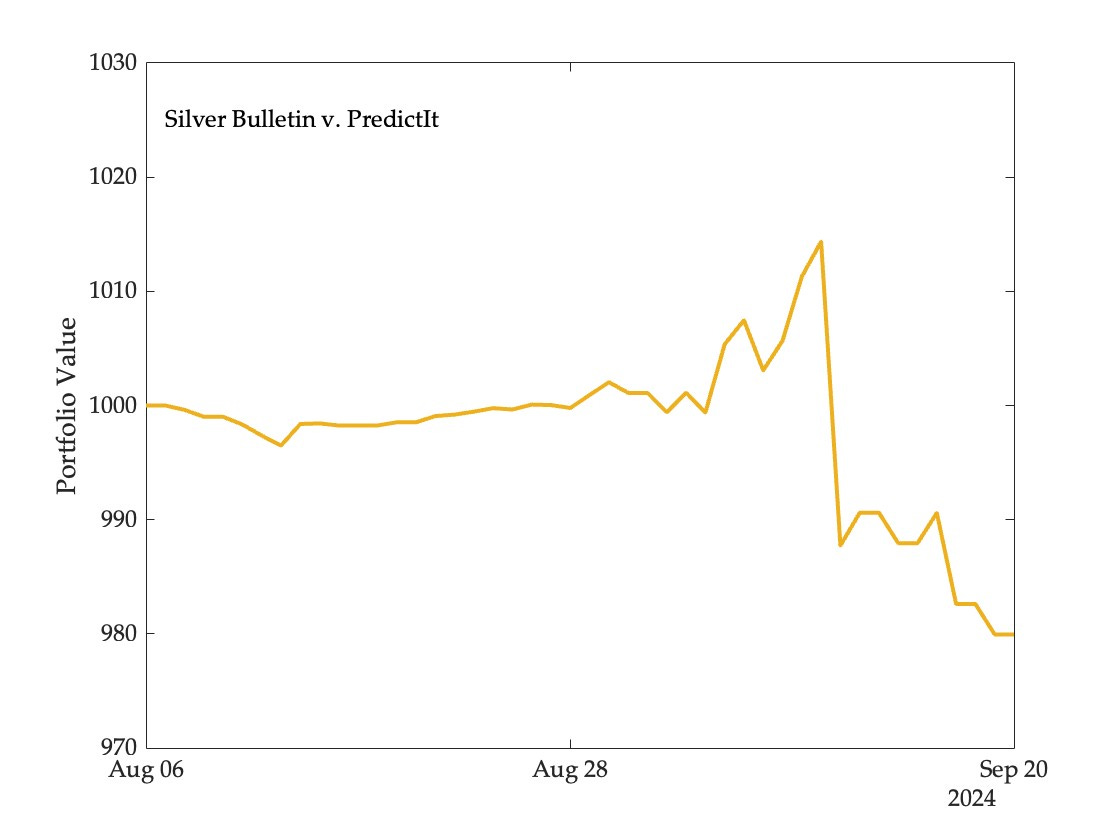
Update. Andrew Gelman has a follow-up worth reading. The figure below shows the value of the Silver Bulletin portfolio trading on PredictIt over the period August 6 to September 20, and you can see that it did quite well initially, before falling sharply as markets responded to the debate:
A commenter on Andrew’s blog responded to this as follows:
Polling is not instant, betting markets knew live that Harris/Trump debate was bad news for Trump, where the Silver model lost value waiting for the polling to come in confirming what everyone knew. So really we would expect these models to lose value purely from this time difference, would we not?
Yes, we would expect this, which makes it all the more surprising that the only portfolio to make a non-negligible loss was Silver Bulletin on PredictIt—all other portfolios came out even or ahead over this period. Models have advantages over markets that can sometimes outweigh the disadvantages of slow reaction to new information.


I highly recommend following https://realcarlallen.substack.com/ - his forecasts seem far less volatile which appear to be more reflective of what a forecast should be.
I wonder how much of prediction markets are also animal spirits and not necessarily information.
Great article! Can you expand on why you believe the position limits on Predictit makes it a better forecaster than Polymarket? I would have expected better liquidity and volume to lead to better forecasts, at least based on their typical impact in financial asset pricing.