


Markets, Models, and Mamdani

Political prediction markets have been around for decades, but rose to unprecedented visibility and prominence during the last election cycle in the United States. This was in large part due to two relatively recent entrants—Polymarket and Kalshi—each of which attracted significant participation, dollar volume, and media attention. By early November, models had converged to a coin flip between the two major party candidates, while markets gave the edge to Trump. Market proponents predictably claimed triumph and vindication once the election was called.
I argued at the time that a single event could not be used to evaluate the relative accuracy of different forecasting mechanisms, and that one ought to reserve judgment until a more systematic empirical exercise could be conducted. Indeed, the outcome of the papal conclave was an embarrassment for markets, as was the Romanian election last month, and now the Democratic primary for the New York City mayor’s race:
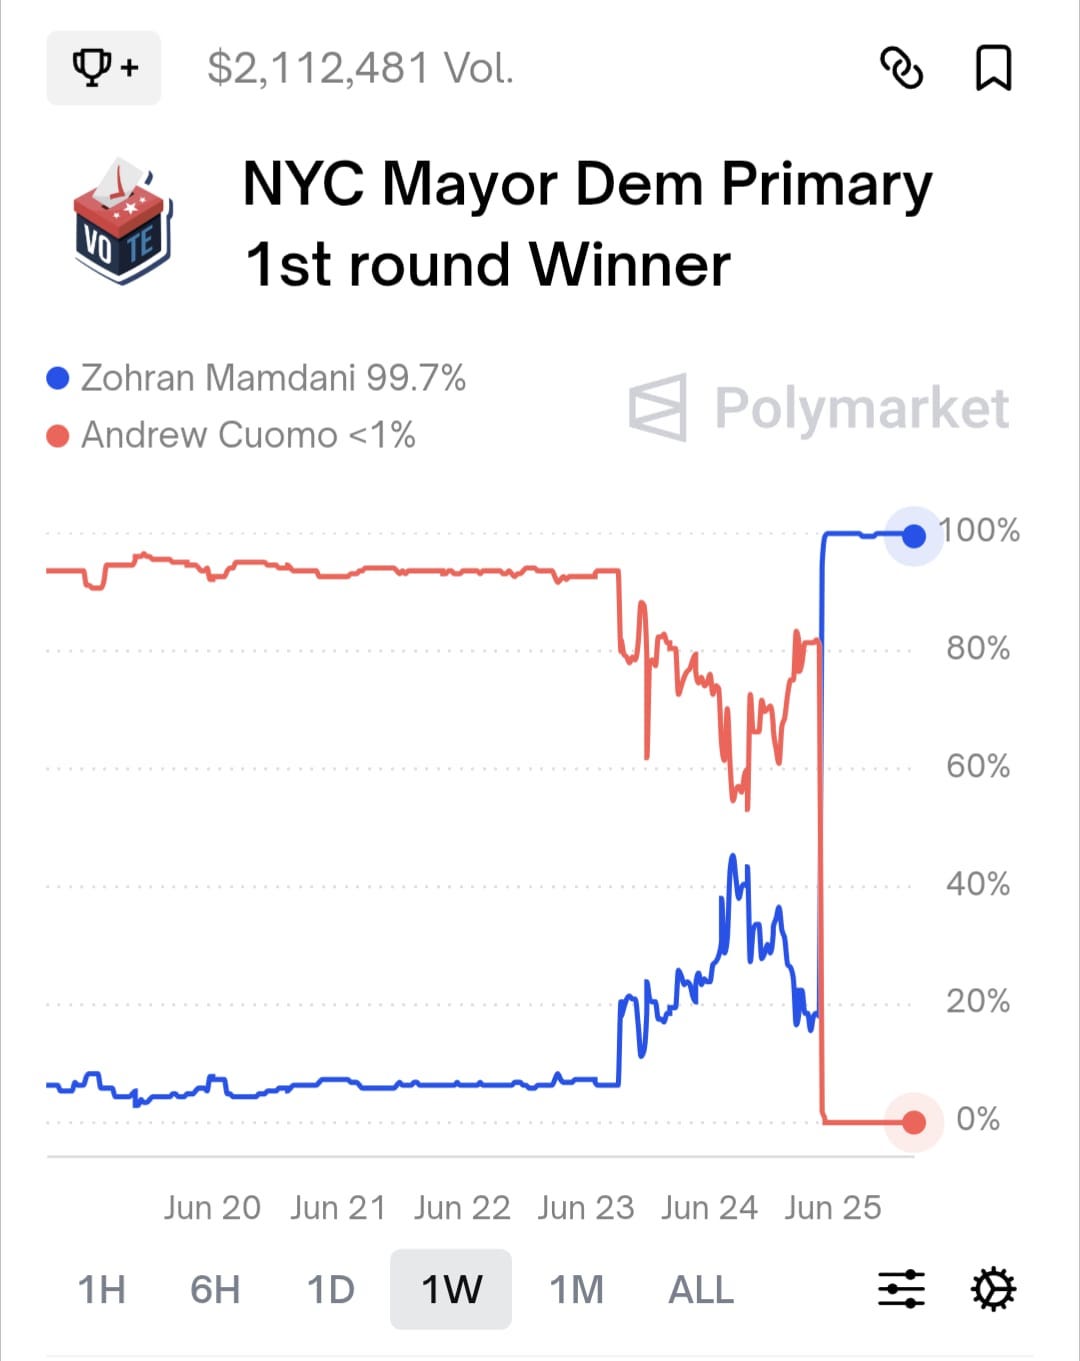
For most of the week leading up to the election, Zohran Mamdani was given a five percent chance of being ahead after the first round. Prices then moved sharply in response to an Emerson College poll that showed Cuomo winning the first round by just three points (and eventually losing after all ranked-choice votes had been tabulated). Even so, as polls closed on election night, Mamdani’s chances of winning the first round were about one in five. As it happens, he won decisively, by a seven point margin.
Was this a failure of markets? To answer the question, one needs to ask: failure relative to what? Of the thirty-two polls tracked by the New York Times, only one (conducted in early June) predicted a first-round victory for Mamdani.1 Markets did poorly but its not clear they were any worse on average than the polls.
For a proper assessment of markets as forecasting mechanisms, we need both a standard of comparison and a method of evaluation. In a recent paper that I’ll be presenting at the Collective Intelligence conference in San Diego this August, such an assessment is conducted for forty-one outcomes decided during the November 2024 elections in the United States: the winners of the presidency, the popular vote, fifteen competitive states in the Electoral College, eleven Senate races, and thirteen House races.2
The method of evaluation is based on a profitability test—a model is said to perform better than the market if a hypothetical trader who believes the model (and is endowed with a budget and some tolerance for risk) makes a profit rather than a loss when updating their portfolio at each model update. This approach can also be used to compare models with each other.3
Why use a profitability test rather than a conventional measure such as the average daily Brier score? For two reasons. First, imagine a pair of models, one of which perfectly forecasts the other one day ahead. These models produce virtually identical forecasts over a long period of observation, and will have similar accuracy scores under conventional metrics. But one of the two models adds no new information, since its forecasts are themselves perfectly predictable. The profitability test is sensitive to the timing of forecasts (relative to the market) and can yield very different results for the two models in this case.
The second reason is a bit more subtle—a flaw in a model that causes it to deviate temporarily and predictably from other models and markets can end up being rewarded by conventional measures if the movement is in a direction consistent with the eventual outcome. As an example, consider the following daily forecasts for the winner of the presidency based on three models and a market:
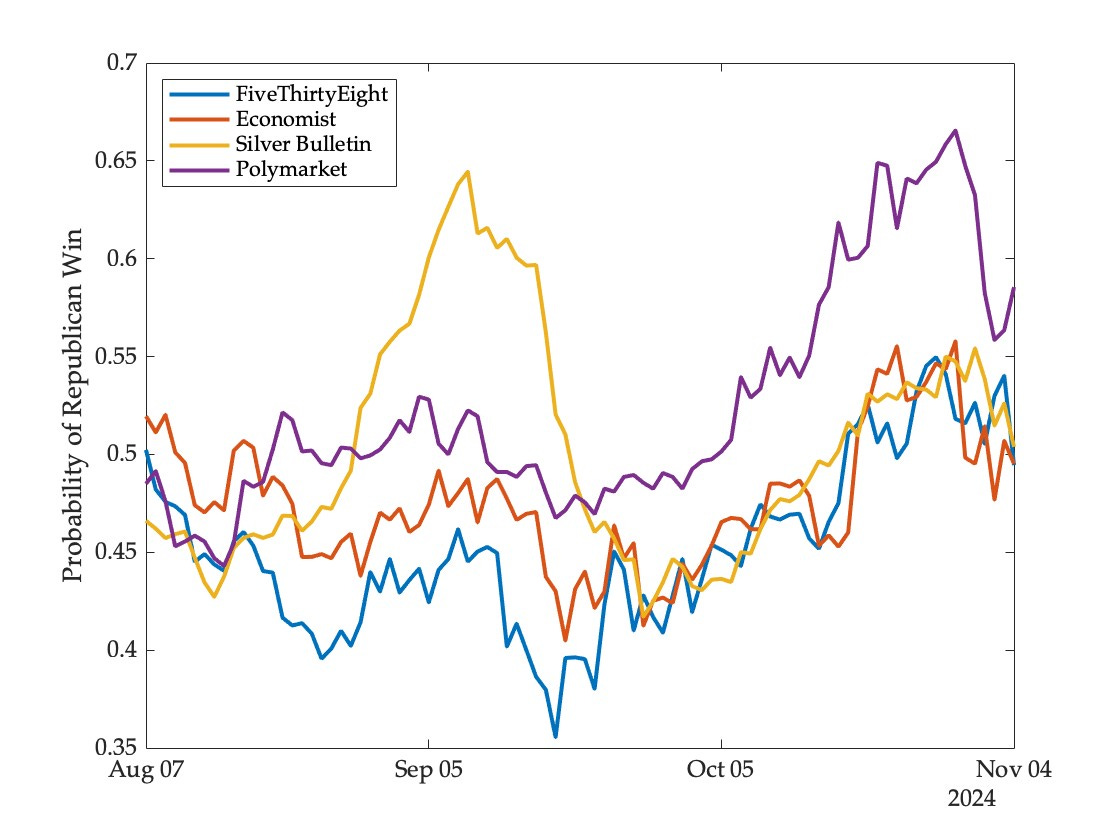
For a period of about four weeks starting in mid-August, the Silver Bulletin model went on an excursion away from other models and the market, eventually returning to the pack in mid-September. This was based on a dubious “convention bounce adjustment” that caused the model to deflate numbers for Harris (and inflate those for Trump) until the Democratic national convention faded far enough into the past. Conventional measures would reward the model for this (given the eventual electoral outcome). But the profitability test does not—the trader representing the model would accumulate shares in the Trump contract and then close out this position at a slight loss upon reversal.4 The shares would not be held to expiration—in fact, from late September onwards, all models suggested that the Harris contract was underpriced, all would have bet on her to win, and all would have incurred losses.
But this superior performance of markets over models did not extend to other outcomes in the same election. Consider, for instance, model and market forecasts for the winner of the popular vote:5
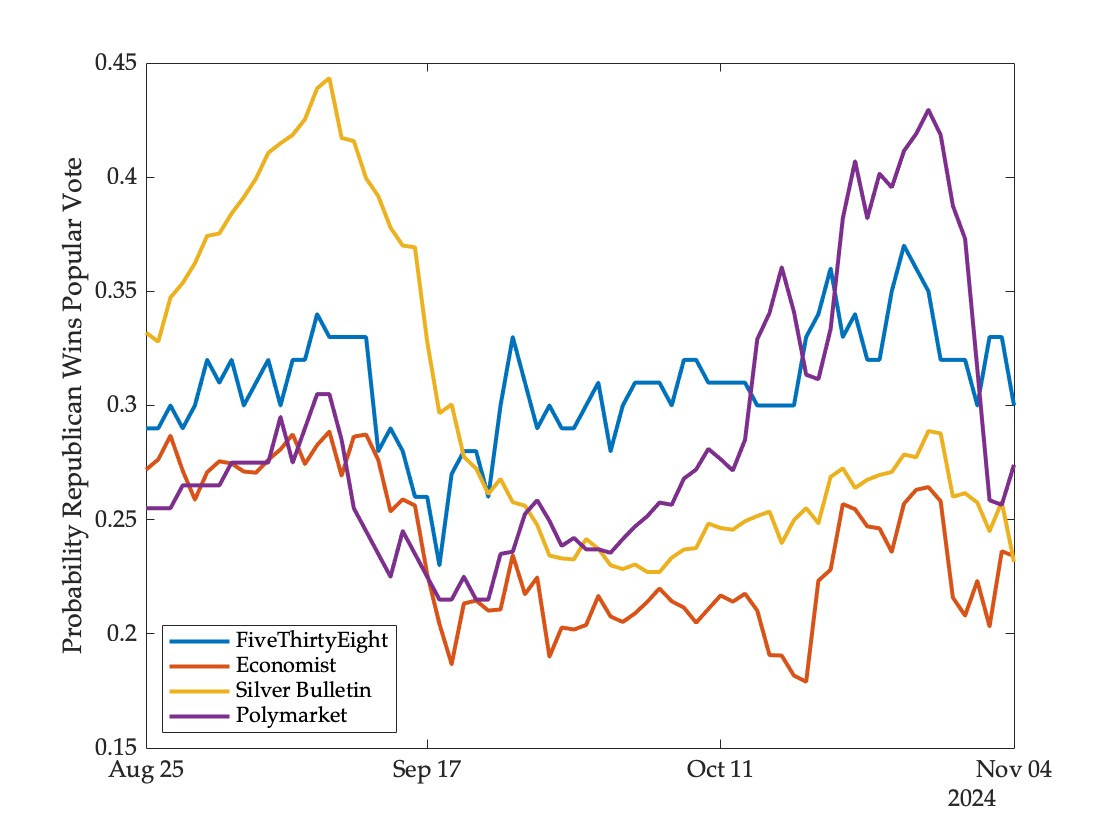
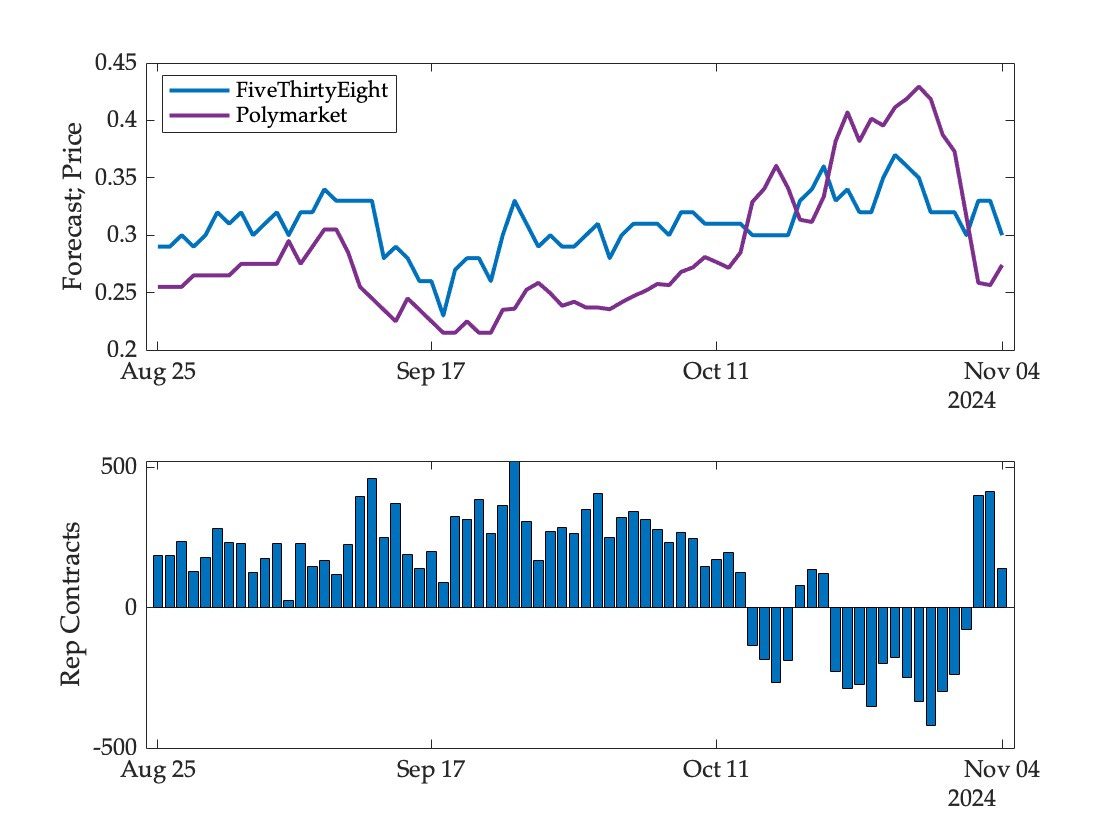
There is one crucial difference between the popular vote and the electoral college forecasts—the FiveThirtyEight model thought that the market was underpricing the Trump contract for most of this period, including on the eve of the election. Given the election outcome, this model ends up making a significant profit on this event (while the other two models make losses). The evolution of the model’s portfolio may be seen in the following figure; the top panel shows model and market forecasts, the bottom panel the number of shares held in the Trump contract (negative shares here indicate a bet on Harris to win the popular vote):
More generally, the models did quite well relative to the market in predicting the outcomes of competitive states and congressional races. Looking only at the winner of the presidency provides a misleading picture of market accuracy.
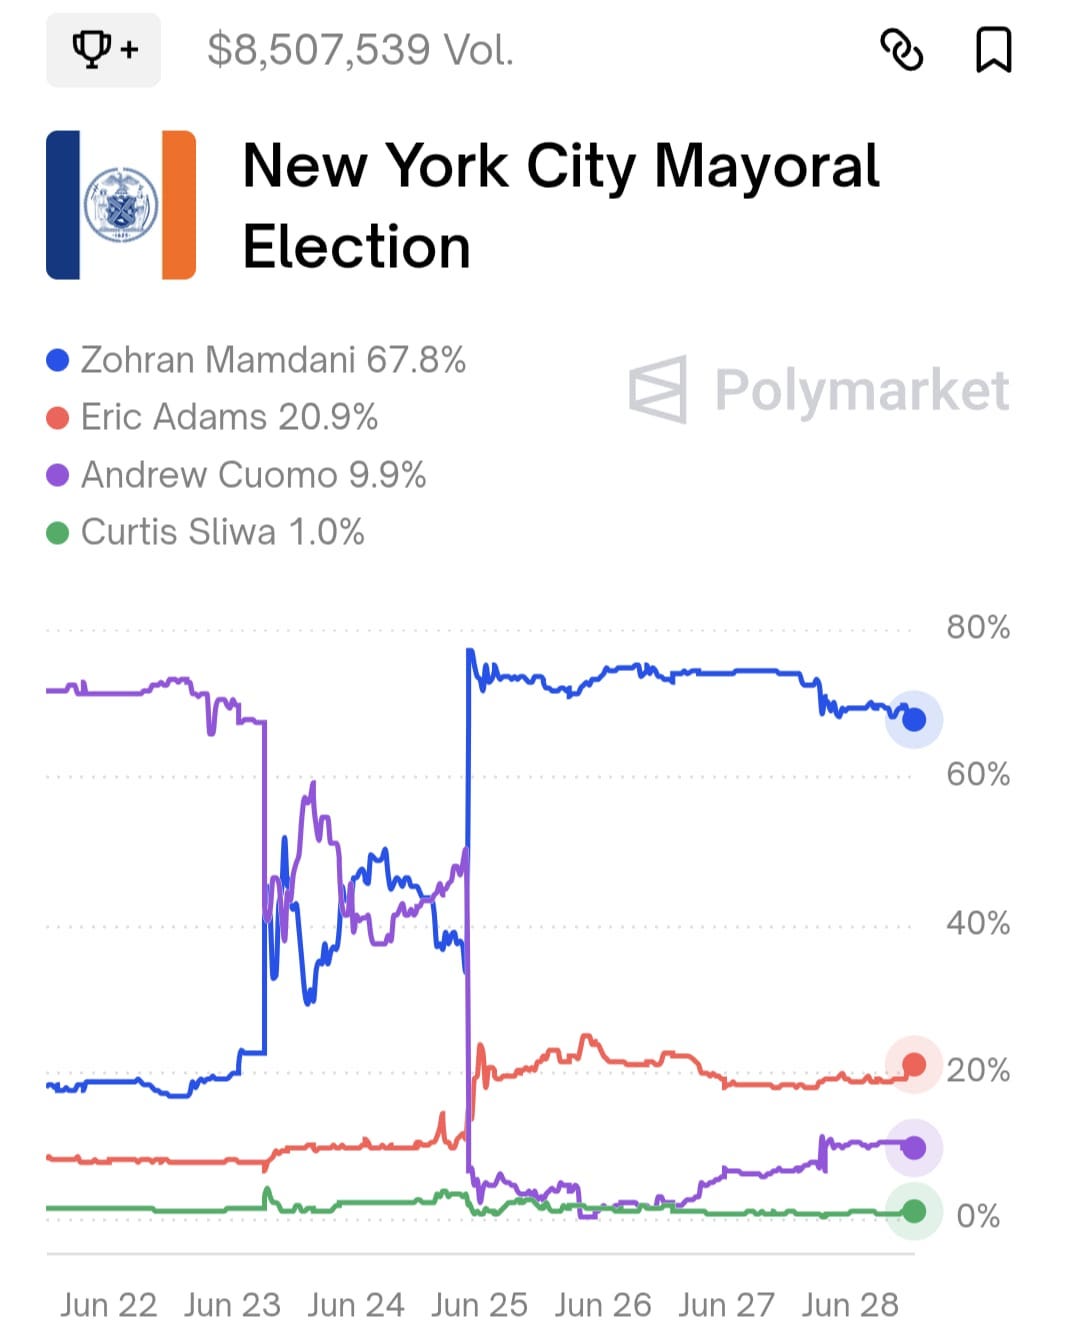
What do markets and polls now say about the winner of the New York City mayor’s race in November? Mamdani’s prospects have fallen a bit since he secured the nomination, and he is now given a two-thirds chance of prevailing:
Meanwhile the only poll I have seen has Cuomo and Mamdani tied if Adams stays in the race, Cuomo ahead if Adams drops out, and Mamdani ahead if Cuomo drops out.
Polls offer a snapshot in time, markets anticipate strategic decisions by the various parties as time unfolds. Disagreement between them this far from election day is not surprising in the least. For Mamdani to prevail, he will have to build support outside the coalition he assembled to win the primary, and engage openly with critics of his policies and prior statements (as he has shown signs of doing). The eventual outcome is hardly a foregone conclusion, and markets will be watching and reflecting every step and misstep.
The polling organization’s explanation for this success was quite straightforward—they saw evidence of “serious demographic change to the electorate” and did not discard or down-weight respondents who chose not to vote in the 2021 race. I suspect that low propensity voters were driven to the polls by highly innovative microtargeting—for example any Hindi/Urdu speaker old enough to remember the Amitabh Bachchan Bollywood era would have viewed this commercial at least a dozen times to pick up all hidden references.
The paper will be published in the conference proceedings. Andrew Gelman was among the developers of the Economist model, and it’s worth reading his perspective on our findings.
Ideally we would want a test that is not sensitive to the level of risk tolerance with which the virtual traders are endowed. In principle, changes in risk tolerance can lead to ranking reversals (this is shown in the paper with an example based on simulated data). But for the actual model and market data from the election we find no such reversals.
To see why the virtual trader representing Silver Bulletin would have made a loss on the round-trip trade, note that the market prices were a bit higher on average during the upswing (when it would be accumulating shares) than on the downswing (when it was selling).
We were able to obtain data for the popular vote winner from FiveThirtyEight for only 75 days leading up to the election.
I generally agree with your post, but (as I emailed you on February 21), my concern about the behavior of the prediction market prices in this particular contest go further than models of the polls. Cuomo was dominating the polls in part due to name recognition, so a market should have expected that he would go downwards in the polls while someone would go upwards. And, combined with rank choice voting, this made a polling lead less valuable than in a plurality vote situation. Thus, I found 70% in the market for mayor 4 months out, shockingly high, because of what the markets should price in about polling movement and voting type, that polling at any given time cannot express.