Forecasting Mechanisms: Another Update
The gulf between models and markets in predicting the outcome of the November election has widened.
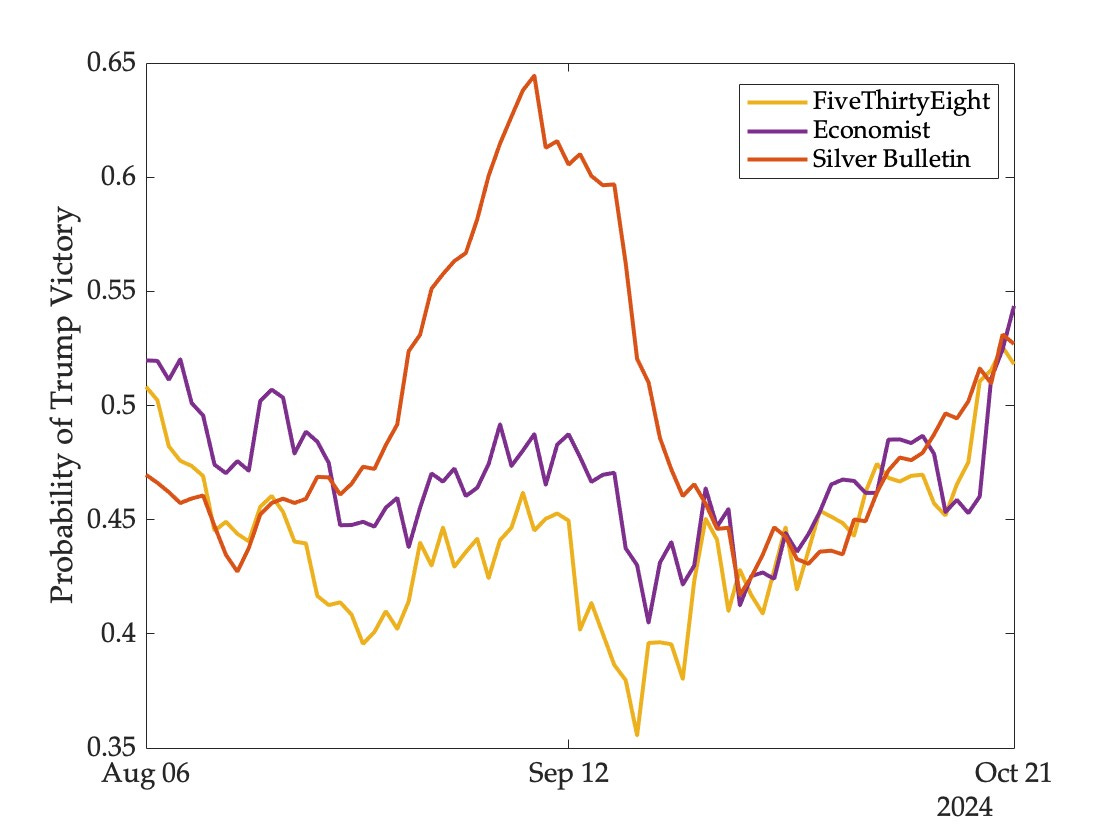
The statistical models that I have been tracking all see the race as a toss-up—the likelihood of a Trump victory is currently 51 percent at FiveThirtyEight, 53 percent at Silver Bulletin, and 54 percent at the Economist. All three models have been close for a while now, although there were moments of considerable divergence since the Democratic nomination was officially secured by Harris in early August:
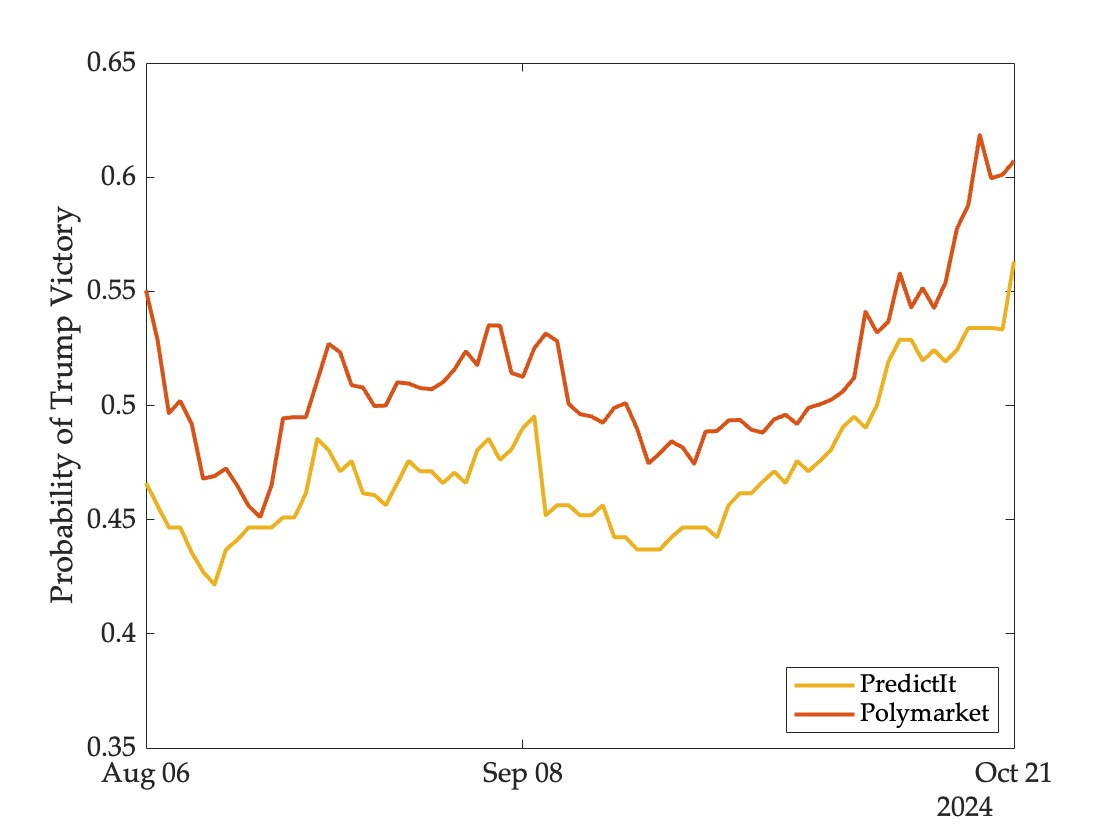
Meanwhile, on markets, the likelihood of a Trump victory stands at 56 percent on PredictIt, 59 percent on Kalshi, and 64 percent on Polymarket (Kalshi first listed this contract just three weeks ago and is omitted from the figure below):
What are we to make of these differences?
To begin with, differences of this magnitude ought not to be surprising—these are completely different forecasting mechanisms, each with their own strengths and weaknesses. Models are built and calibrated based on historical data, proceed on the assumption that the past is a reasonably good guide to the future, and absorb information relatively slowly. Markets can take all kinds of novel and non-public information into account and respond very quickly to changing circumstances. But they can also come to be dominated by a few large traders whose beliefs then have a disproportionate impact on prices, irrational exuberance is not uncommon, and incentives exist to move prices in ways that influence public perceptions of viability and momentum.
Which of these forecasting mechanisms is more reliable on average is therefore an empirical question—one cannot reason one’s way to an answer.
One way to evaluate forecasting accuracy is by using a profitability test. Given any model and market, one can track the portfolio that would be constructed by a virtual trader who believes the model output and trades based on market prices. Different models will be represented by different traders who will obtain different returns, and some markets may be harder to beat than others. In this way one can compare the performance of different forecasting mechanisms even prior to event realization.
In my last update I reported that PredictIt was the hardest market to beat and FiveThirtyEight the most profitable model. But the sharp increase in prices of the Trump contract on markets has changed the picture.
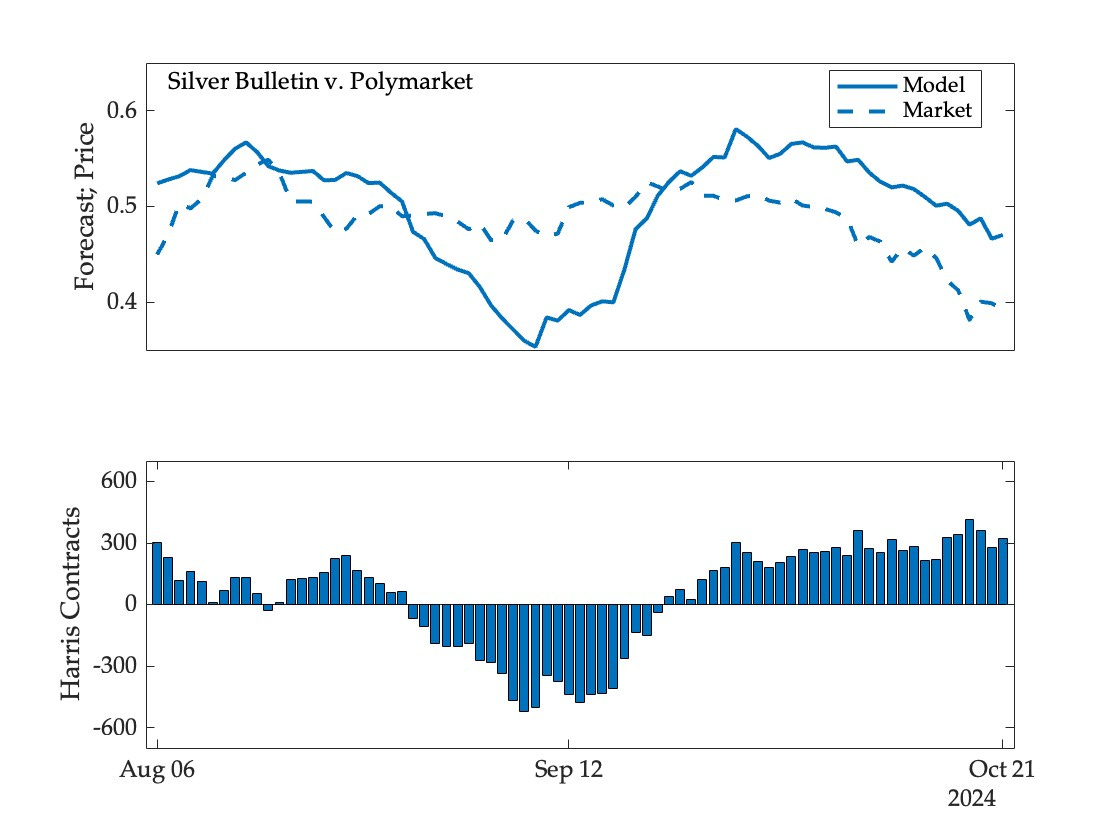
Here, for example is the Silver Bulletin portfolio on Polymarket, which was betting against Harris in mid-September but more recently has been betting against Trump (and paying a price for it):
And here is the value of the portfolio over time:
Repeating this exercise for the other models and markets, we obtain the following returns:
Since the models have recently accumulated Harris contracts (betting on a Trump loss) they are all now in the red. Their portfolios have lost value for the same reason as the largest buyer of Trump contracts on Polymarket has reached the top of the profitability leaderboard.
Does this mean that models are performing poorly relative to markets? Tentatively, yes. But this could change quite dramatically—in either direction—over the next few days. If markets really are frothy and we see a correction, the models will experience gains. We have a couple of weeks to wait, and a lot of other events to track—including swing state and popular vote forecasts—before any definitive assessment can be made. I hope to post another update soon.


Sorry for my ignorance, but how does the profitability test work before the event happens? How do you distinguish between the models being wrong and the markets being persistently biased (such that the models keep diverging further and further from them)? Indeed wouldn't you need numerous events to get a reliable signal?
I think I've misunderstood this a bit, sorry.
Fantastic update. Planning on updating my readers this evening as well!